

For product managers, user reviews are a priceless source of insights about problems, requests, feature ideas, and audience use cases. But there’s a catch: manually analyzing text reviews is hard. That’s why teams often either ignore them altogether or analyze them rarely and inconsistently.
We decided to streamline the process of analyzing and organizing user feedback with GPT. As a result we got a automated dashboard that updates daily and delivers tons of value and insights.
In this article, we’ll cover:
- What to focus on when analyzing reviews and how to structure the report
- How to prepare data for automated analysis
- How to set up regular review processing using GPT
Technologies We’ll Use:
- OpenAI API;
- AI Orchestrator to manage the logic of GPT requests (we use an internal tool, but Langflow, n8n, or others will work);
- ETL that we use to extract reviews from the data storage, process them, and put the results back.
First, we’ll show you what our review dashboard looks like, and then we’ll break down how we built it.
1. What Our User Feedback Dashboard Looks Like
We wanted to create a clean, concise dashboard that you can quickly scroll through on a single page to get a snapshot of current user sentiment. And if something catches your attention, you can “drill down” to read specific review texts.
The dashboard updates daily and automatically.
Below is the information we display.
Key Metrics
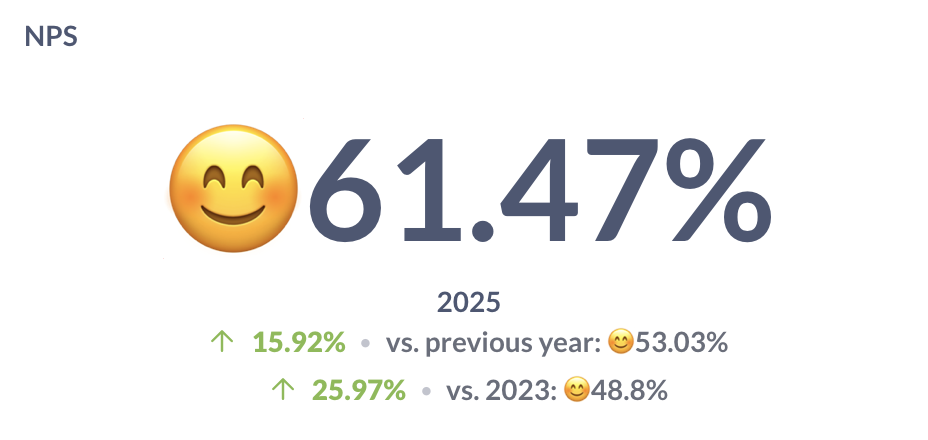
NPS
We like having a single, simple metric that’s easy to check at a glance.
For feedback analysis, the goto metric is NPS (Net Promoter Score). It’s based on the question:
"How likely are you to recommend our product/service to a friend or colleague?"
Respondents rate their experience from 0 to 10.
When calculating NPS, the following simplifications are used:
- 9–10 → Promoters
- 7–8 → Neutrals
- 0–6 → Detractors
Then, NPS is calculated by using the standard formula:
NPS = % of Promoters − % of Detractors
Sometimes, numerical ratings aren’t available, but we can try to estimate NPS based on text reviews using Sentiment Analysis.
Using GPT, we analyzed the sentiment of each review, classifying them as positive (promoters), neutral, or negative (detractors). This allowed us to calculate an NPS across all reviews.
It turned out to be pretty convenient.
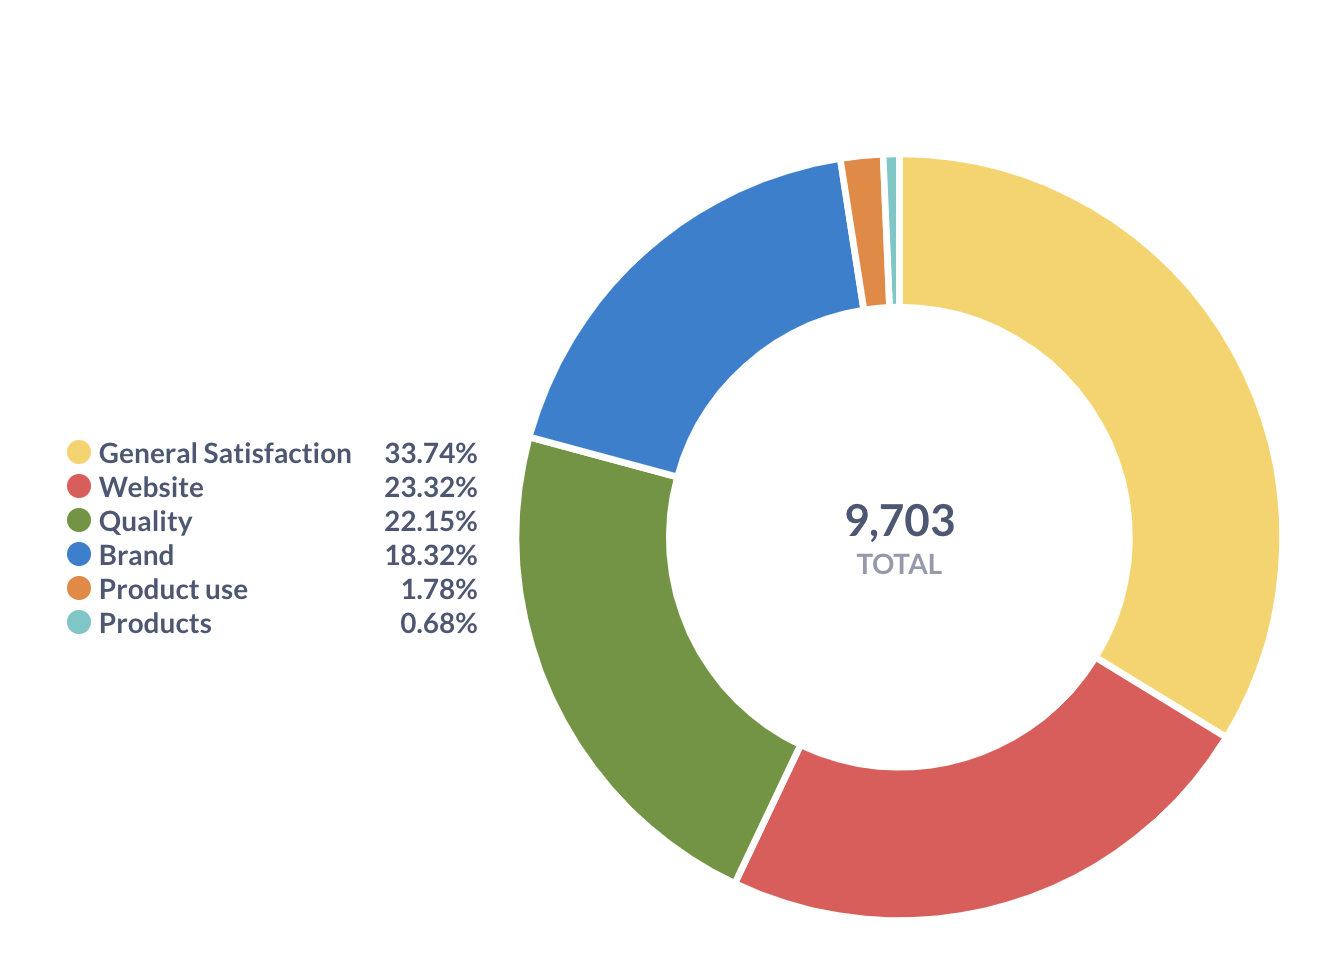
Review Categories
We defined the review categories before starting automation. It’s a semimanual process.
First, we gathered feedback from business users to find out which topics they were most interested in within the reviews. Then, we showed existing reviews to GPT and asked it to suggest a categorization.
Based on business requests and basic analysis with GPT, we created a list of key user feedback categories.
Here’s what we came up with:
- General Satisfaction – Overall feedback on product satisfaction
- Website – Feedback about website performance
- Quality – Feedback on service quality
- Brand – Reviews related to the brand as a whole, not specific products
- Product Use – Feedback about using products without mentioning specific ones
- Products – Reviews about specific products.
It’s convenient to have 7 ± 2 toplevel categories.
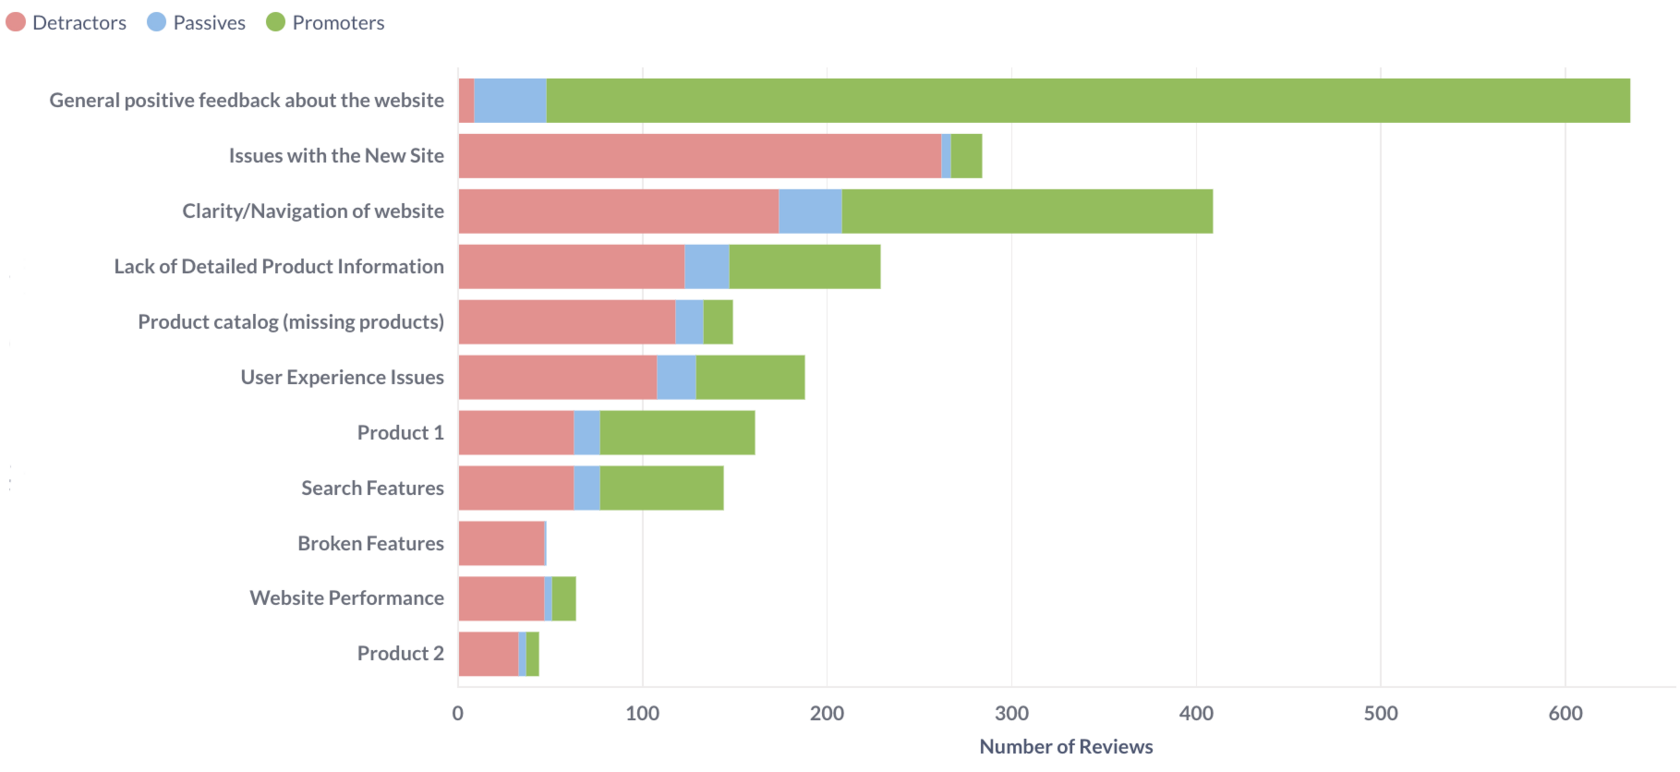
Distribution of Positive, Neutral, and Negative Reviews by Category
Now, for each review, we know its category and sentiment, and we can create the first interesting report.
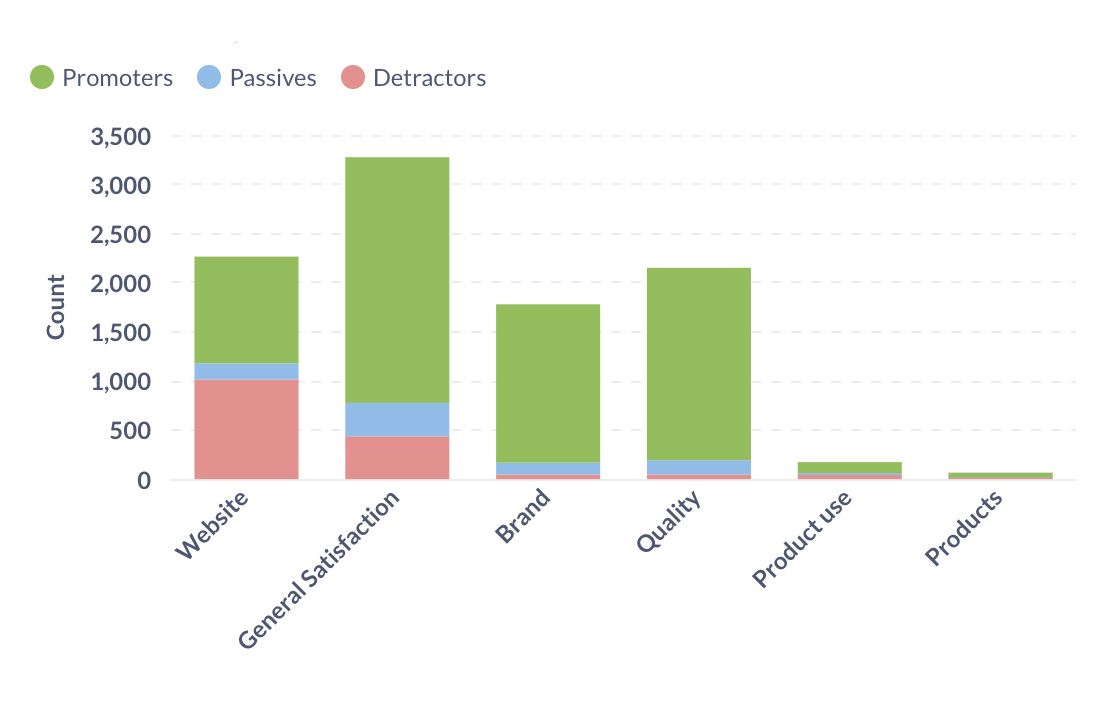
It’s clear that while users are generally satisfied with the product and service, there are some concerns about the website’s performance.
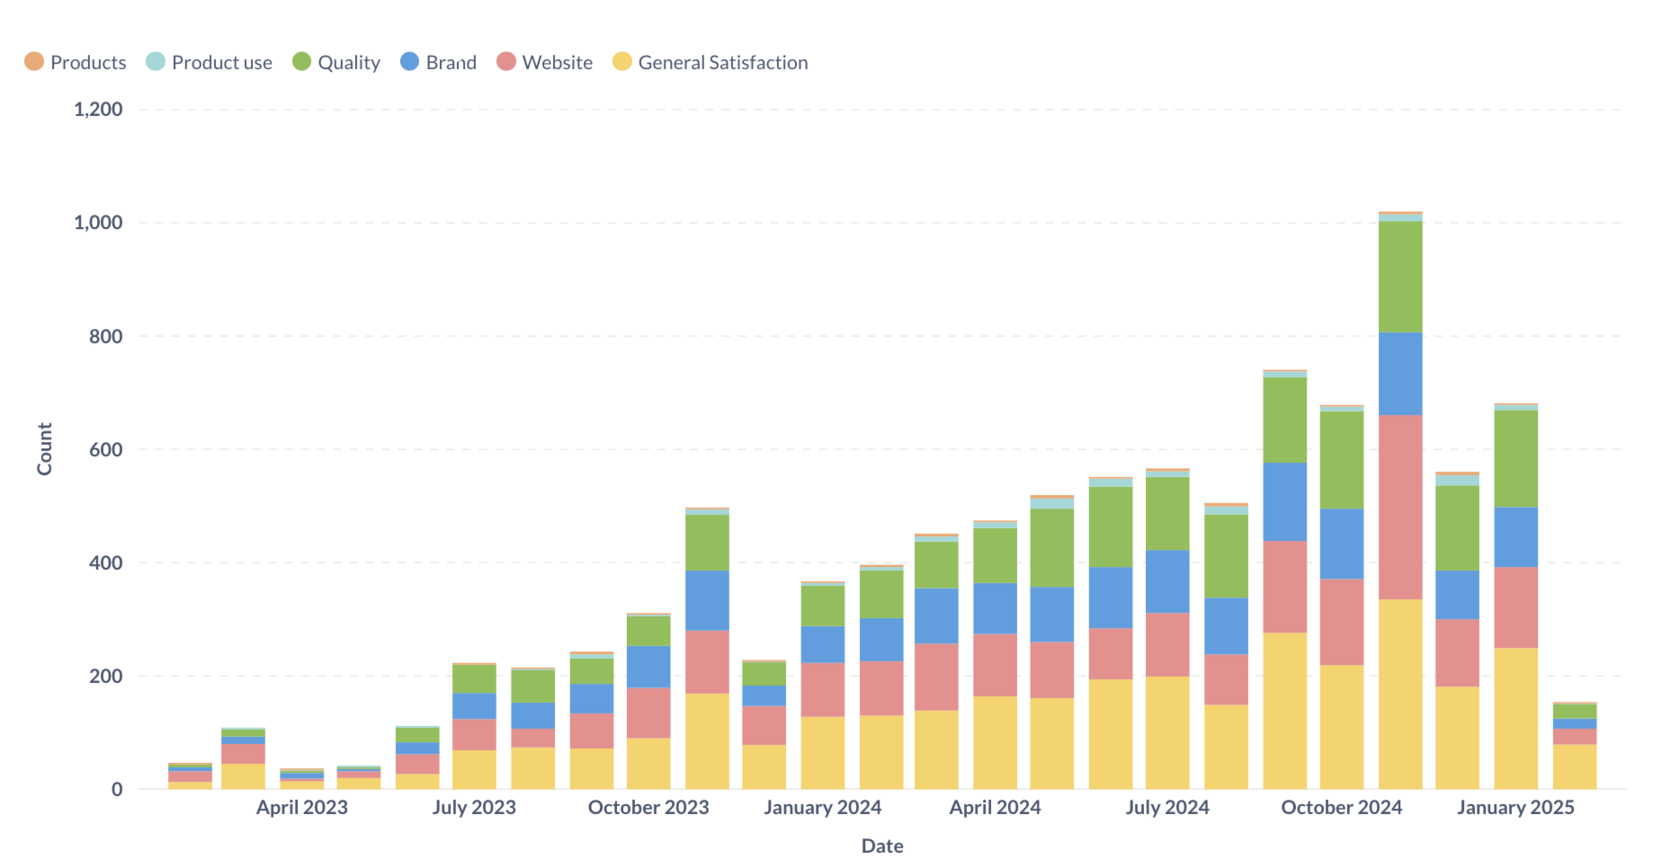
Monthly Review Trends by Category
Using the same dataset, we can track the monthly dynamics of review categories. We can see that in November, there was a significant increase in feedback about the website. Interesting, so what happened?
Metrics for a Specific Category
Trends of Positive, Negative, and Neutral Reviews by Category
For each of our review categories, we’ve mapped out the trends of positive, negative, and neutral feedback.
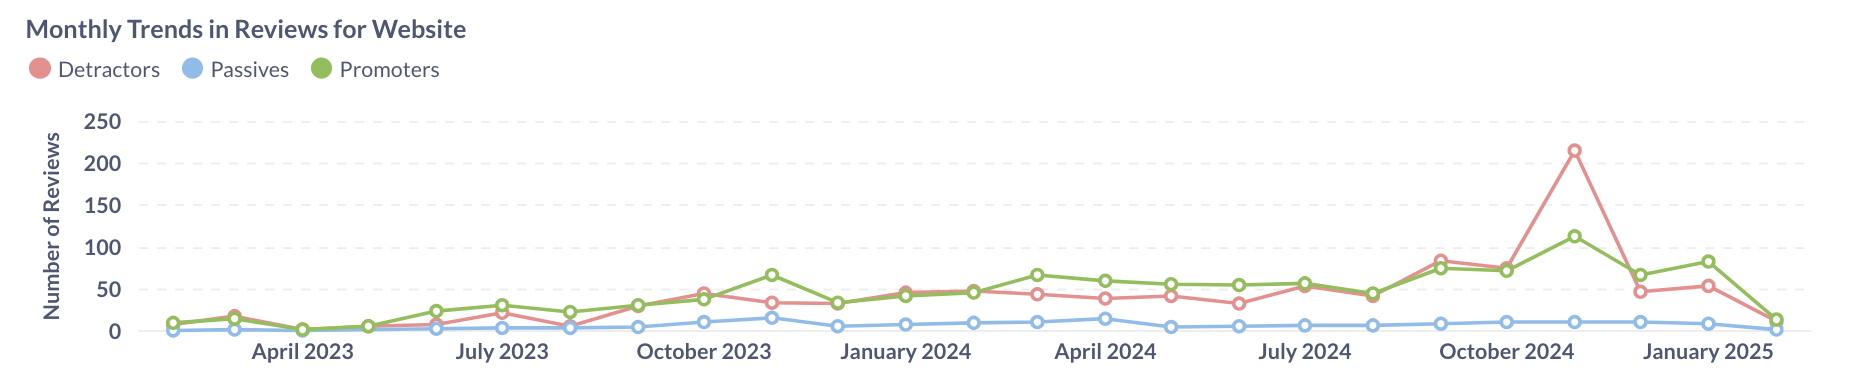
Whoa, something happened in November. We can see a clear spike in negative reviews about the website. What’s bothering users?
Key Themes
To track common patterns in user feedback, we identify key themes for each review category.
We export all reviews under the Website category. Upload them to GPT and ask it to analyze and identify the main themes.
We review GPT’s response, edit and finalize a specific list of typical themes for each category.
Our analysis revealed a theme called “Issues with the New Site” with the highest number of negative comments. That’s really interesting!
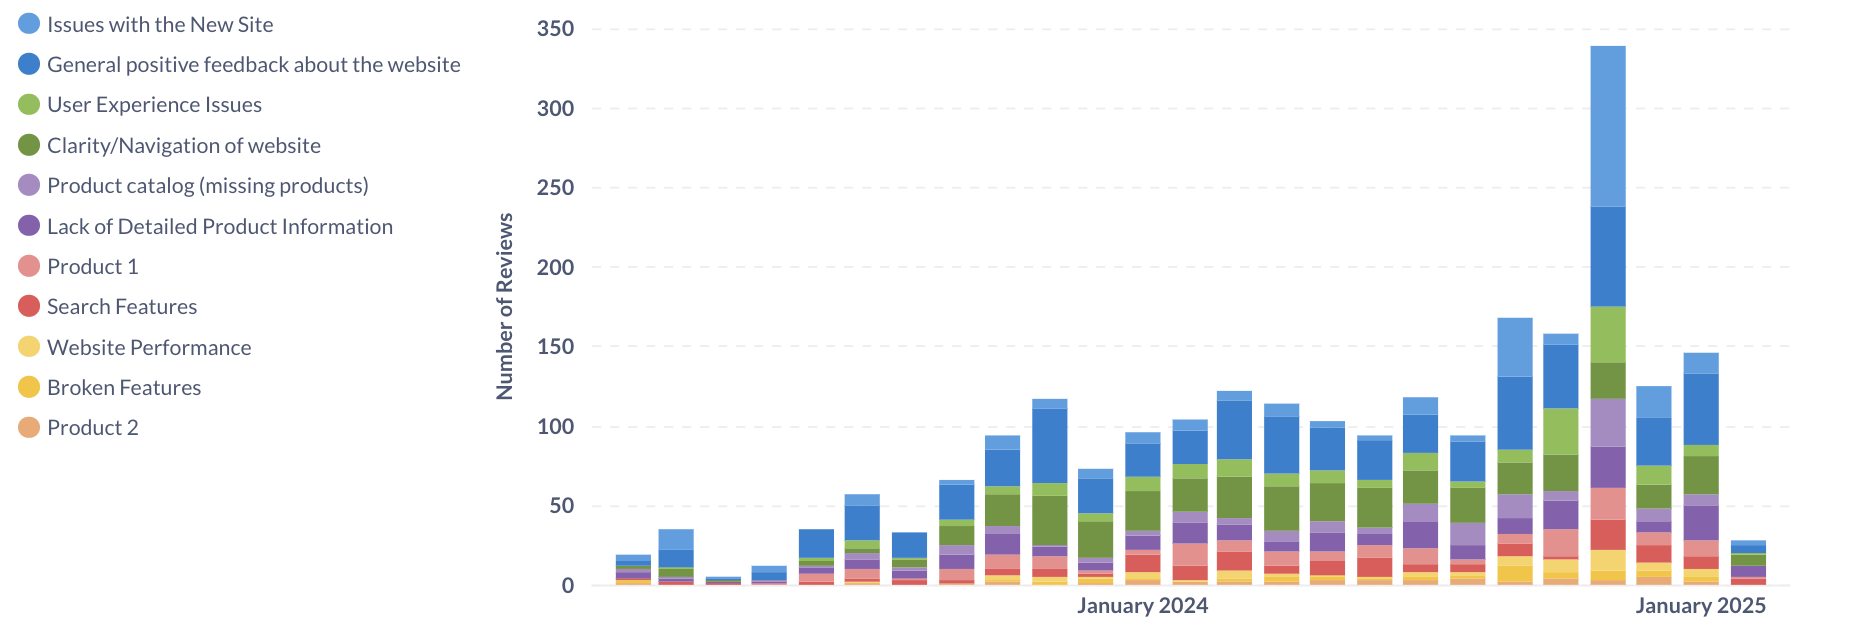
Monthly Review Trends by Theme
Now we know what happened. In November, there was a new website release, and people started reporting issues en masse!
This report helps us track how the volume of reviews related to a specific theme changes over time. For example, we can see whether the number of reviews mentioning “Issues with the New Site” is increasing or decreasing month by month.
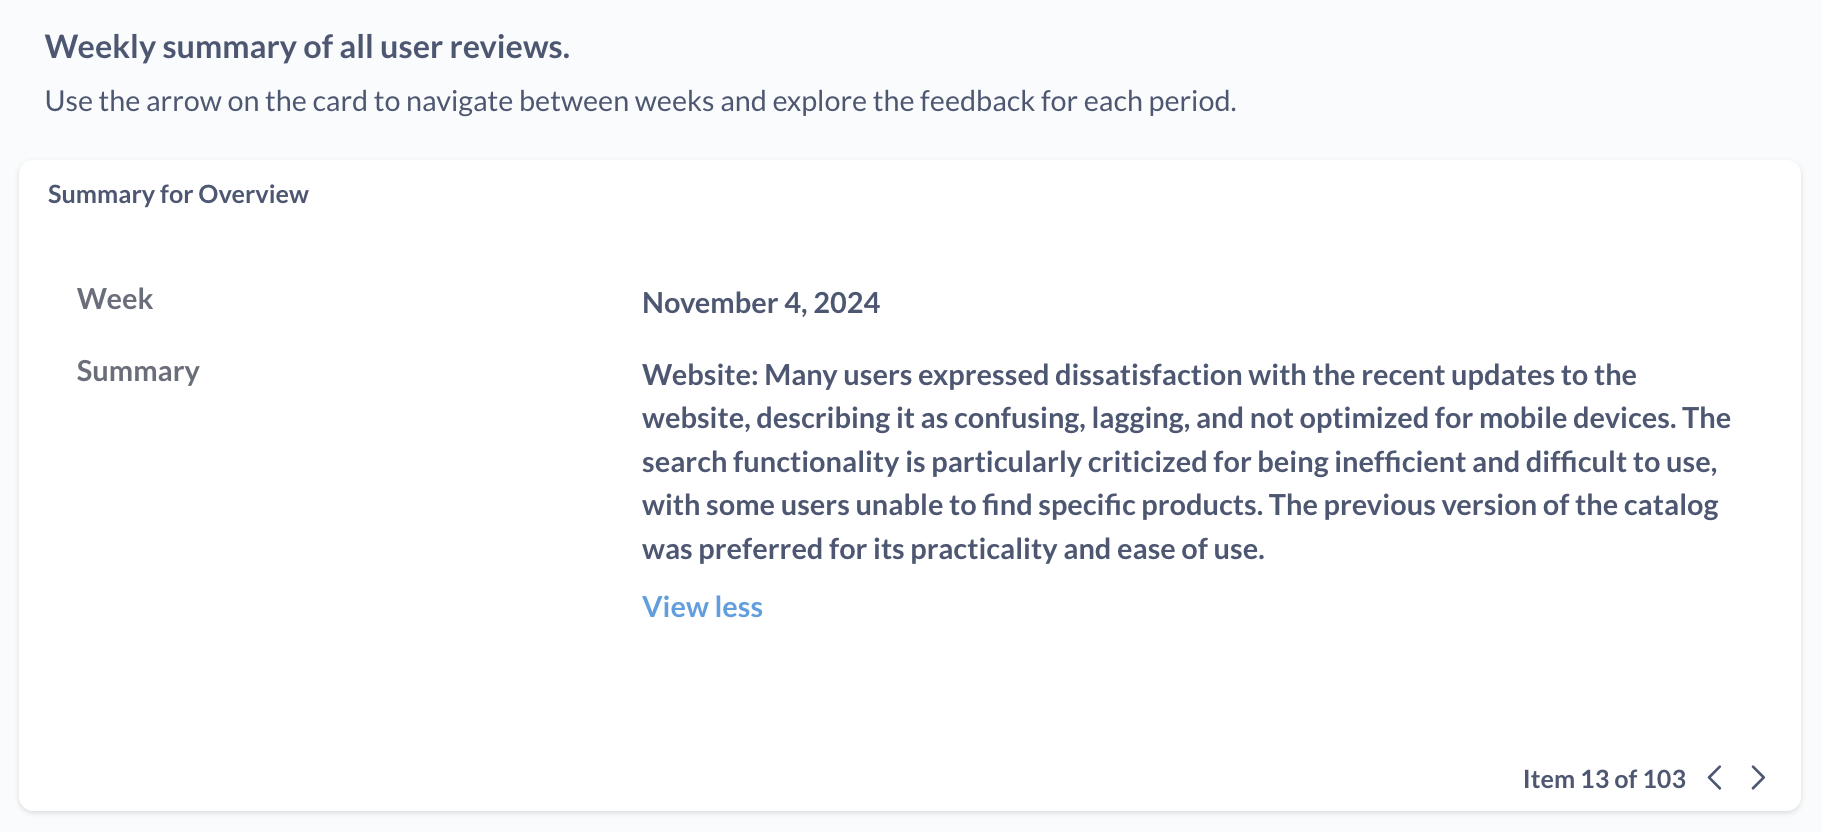
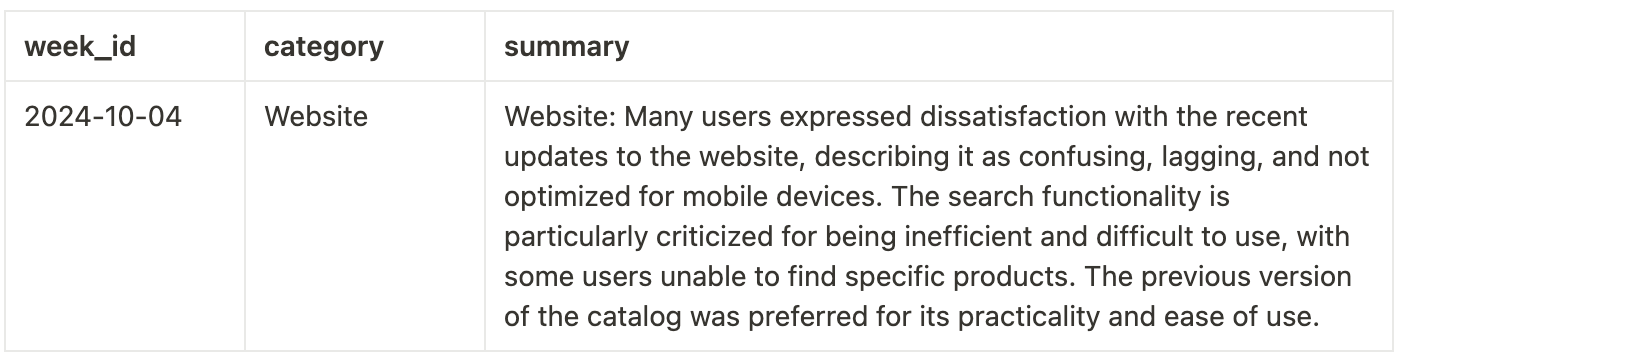
Automated Weekly Summary of All Reviews
So, we’ve figured out that users didn’t really like the website update. But what exactly went wrong?
We can gather all Website category reviews for the week and ask GPT to generate a brief summary. These summaries will be automatically generated every week and stored in the database to be displayed on the dashboard.
In my opinion, the automated summary widget is the most useful feature on our dashboard. It not only shows the numbers but also provides an executive summary of what users wrote during the week. It’s like having an intern finally deliver a clear, concise report.
We’ll also keep the option to view the original review texts. To make this easier, we’ll translate all reviews into a single language (in our case, English).
2. How It Works
Data Format
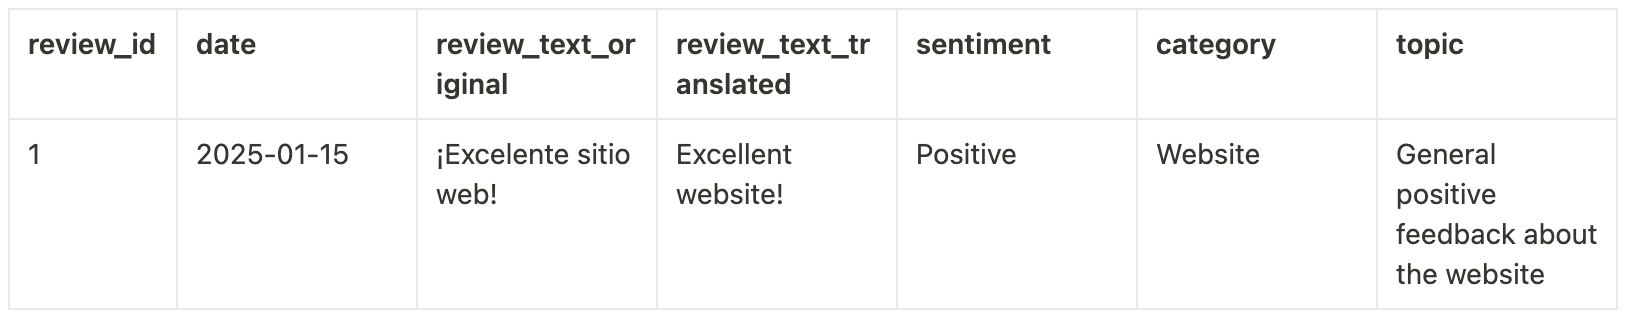
All our reports are built using data in the following format:
Table of Reviews
Summary Table
What GPT Does
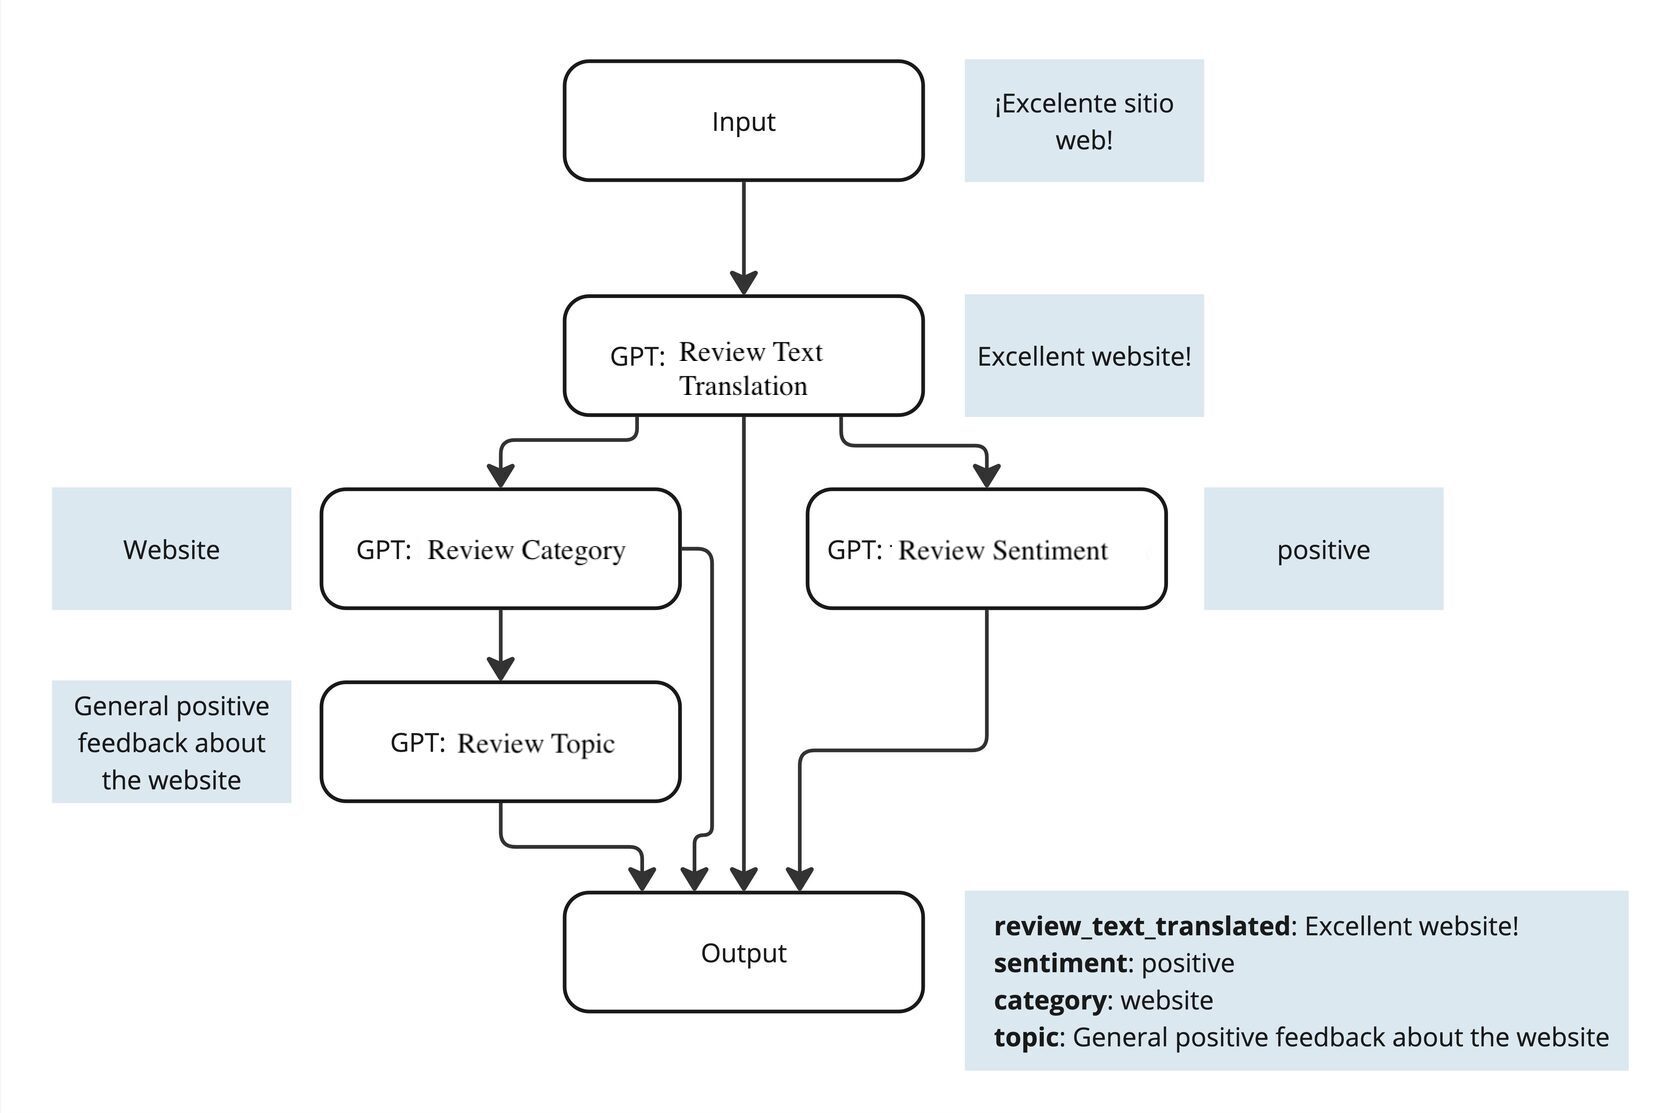
To get the values for review_text_translated, sentiment, category, topic, and summary, we use GPT with the help of several prompts:
- Prompt for Text Translation.
- Prompt for Sentiment Analysis.
- Prompt for Category Identification.
- Prompt for Topic Detection within each category.
(You could try to get all the answers with a single prompt, but that increases the chance of errors.)
We also need a prompt to generate a summary of all the reviews for the week.
AI Orchestrator
To build the processing pipeline for a single review using GPT, we used an AI orchestrator, a service that allows you to create and test a chain of prompts through a visual interface. We used an internal tool, but n8n or Langflow could work just as well.
The AI orchestrator lets you set up text processing workflows in a visual interface without coding and creates an API endpoint that can be accessed programmatically.
Automation
The AI orchestrator works as an API. Using Python, we:
- Submit the review as input.
- Receive all the meta-information related to the review.
- Save this information to the database.
The script runs daily to process new reviews.
Done.
Results
Thanks to this visualization, we can:
- Identify key issues users face and focus on solving them.
- Respond quickly to user feedback.
- Reach out to dissatisfied users to address their concerns.
- Enable different teams to work with reviews easily, focusing only on their specific domains (e.g., product catalog, technical support) through dedicated categories.
Conclusion
Feedback analysis is an opportunity to genuinely improve your product. With automation, the process becomes faster, simpler, and clearer.
If you’re facing challenges in handling reviews, then our approach might help you make the process more efficient and focused on the real needs of your customers.

