

The Task
Motul has a main website, motul.com, and numerous satellite sites. These platforms feature products for users, including:
With multiple data sources, the marketing team spent a significant amount of time consolidating information—tracking traffic and metrics across all sites and monitoring the brand's activity on social media.
- Selecting motor oil and related products by car brand.
- Reseller search to find authorized sellers.
- Product pages showcasing items for specific brands and models.
With multiple data sources, the marketing team spent a significant amount of time consolidating information—tracking traffic and metrics across all sites and monitoring the brand's activity on social media.

Our task was as follows:
- Create a dashboard with key performance indicators (KPIs) for top management.
- Provide teams with tools to analyze user behavior on the websites.
- Build conversion funnels for key products.
- Deliver insights on product popularity across the countries where the brand operates.
SOLUTION
Downloading Raw Data
First, we collected data for analysis.
We chose BigQuery as the data storage solution. The data sources included:
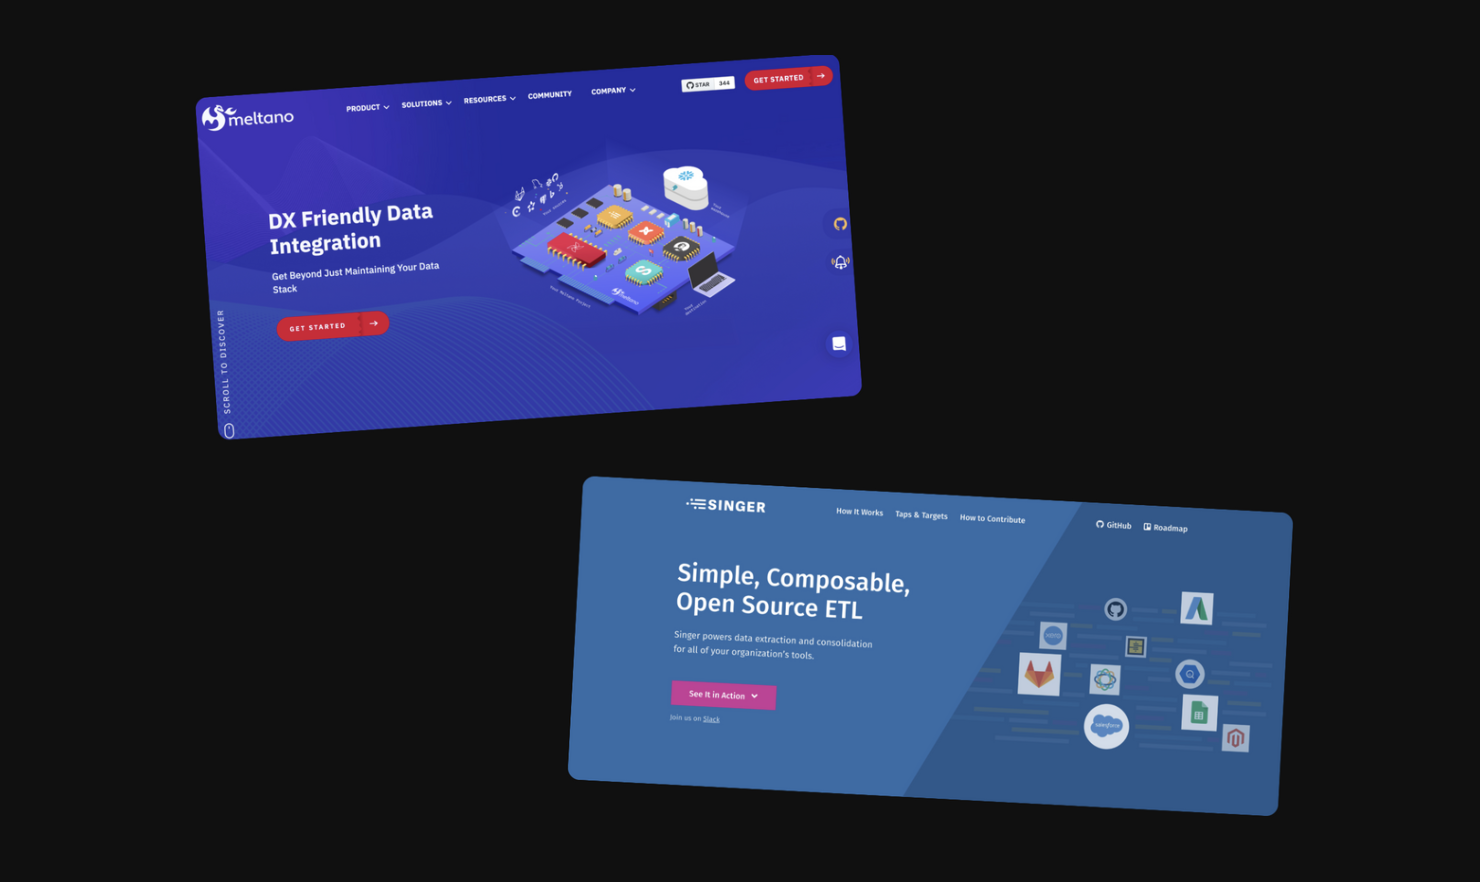
To load the data, we configured a technology stack using Singer + Meltano.
- Six Motul websites.
- A REST API providing metadata for product page content.
- Hookit data on the brand's social media activity.
To load the data, we configured a technology stack using Singer + Meltano.
Data Modelling
During the analysis of raw data, we faced an issue: event tracking was not always implemented in Google Analytics. In most cases, only page view data was available via URLs. However, for the dashboards, we needed detailed statistics on views broken down by products, categories, and car/motorcycle brands. This meant that before visualizing the data, we had to enrich the dataset with the missing information.
For designing the data model, we used the Minimal Modeling approach (minimalmodeling.com), which helps simultaneously understand the data structure and document it effectively.
As a result of the modeling process, we identified the following:
The identified anchors, attributes, and links were documented immediately in an Excel file. This approach enabled us to create a detailed description of the final data structure even before implementation.
The final data model looks like this:
For designing the data model, we used the Minimal Modeling approach (minimalmodeling.com), which helps simultaneously understand the data structure and document it effectively.
As a result of the modeling process, we identified the following:
- Anchors – key entities of the domain (e.g., User, Page, Brand).
- Attributes – characteristics of the anchors (e.g., Page Name, User Registration Date).
- Links – relationships between anchors (e.g., "User opened Page").
The identified anchors, attributes, and links were documented immediately in an Excel file. This approach enabled us to create a detailed description of the final data structure even before implementation.
The final data model looks like this:
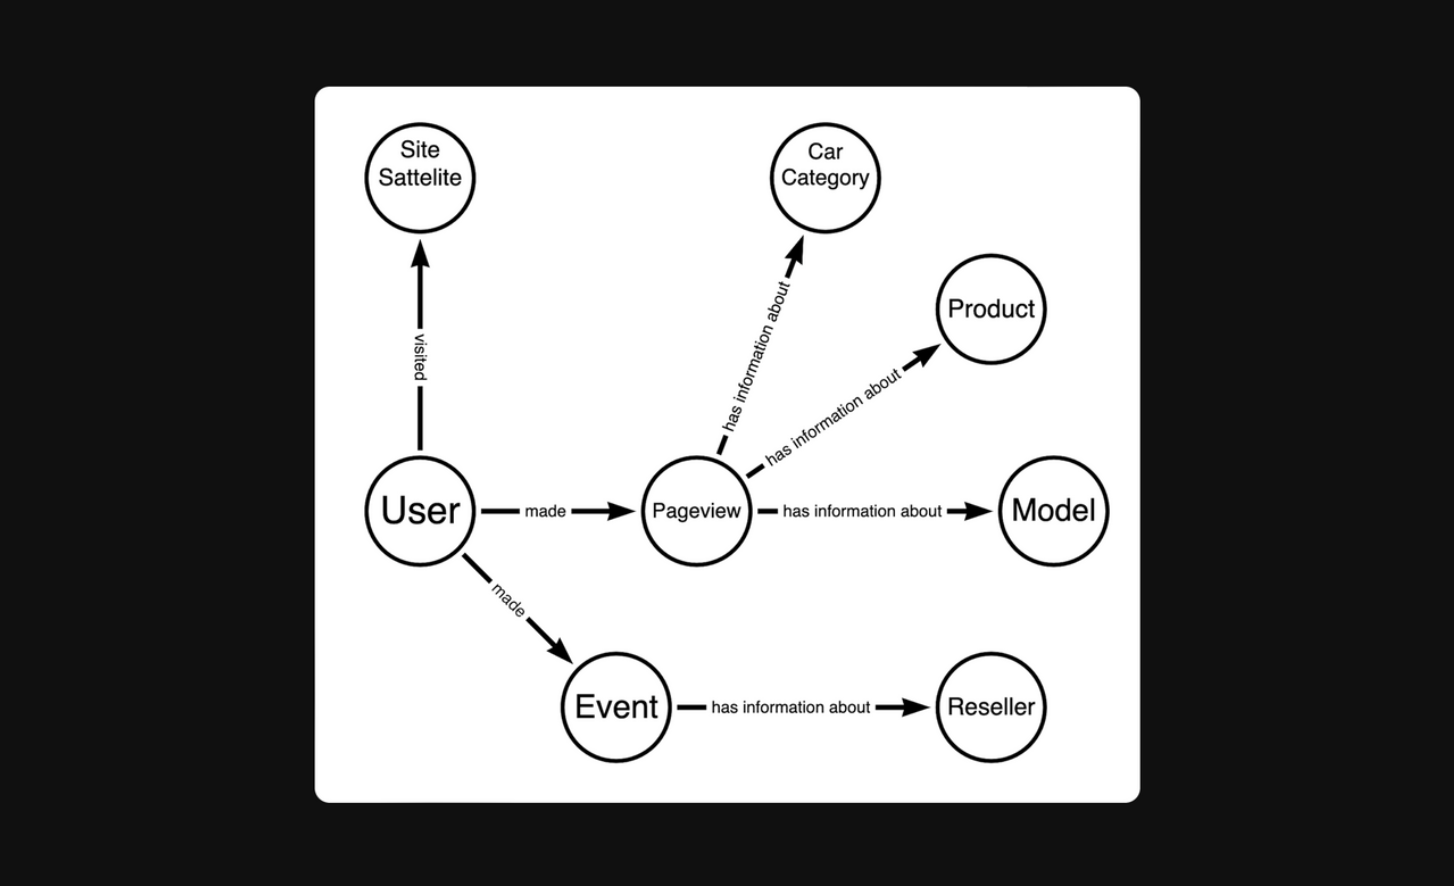
Although the data model was logically straightforward, establishing connections between certain data segments proved challenging.
For instance, determining that a user viewed a product in a specific category required parsing the parameters from the page URL. The task was further complicated by the varying URL structures across different sections of the website.
For instance, determining that a user viewed a product in a specific category required parsing the parameters from the page URL. The task was further complicated by the varying URL structures across different sections of the website.
Data API Implementation
At the physical implementation level, all anchors, attributes, and links are represented as separate, independent tables in the database.
This approach significantly simplifies testing: each table reflects the complete transformation graph of the data. If an error occurs, we can trace it back to the original data.
Additionally, with each attribute as an independent table in the database, multiple analysts can work on implementing attributes in parallel, enhancing efficiency.
We refer to these tables as Data API because they serve as an interface to the customer’s data, usable for BI reports, ML models, and other applications.
Building a Power BI Data Mart
On top of the data from the Data API, we create wide tables designed specifically for visualizing reports in Power BI.
When refining the logic for processing raw data, we only update the logic within the Data API. All wide tables for reporting are then automatically recalculated, ensuring consistency and up-to-date insights.
When refining the logic for processing raw data, we only update the logic within the Data API. All wide tables for reporting are then automatically recalculated, ensuring consistency and up-to-date insights.
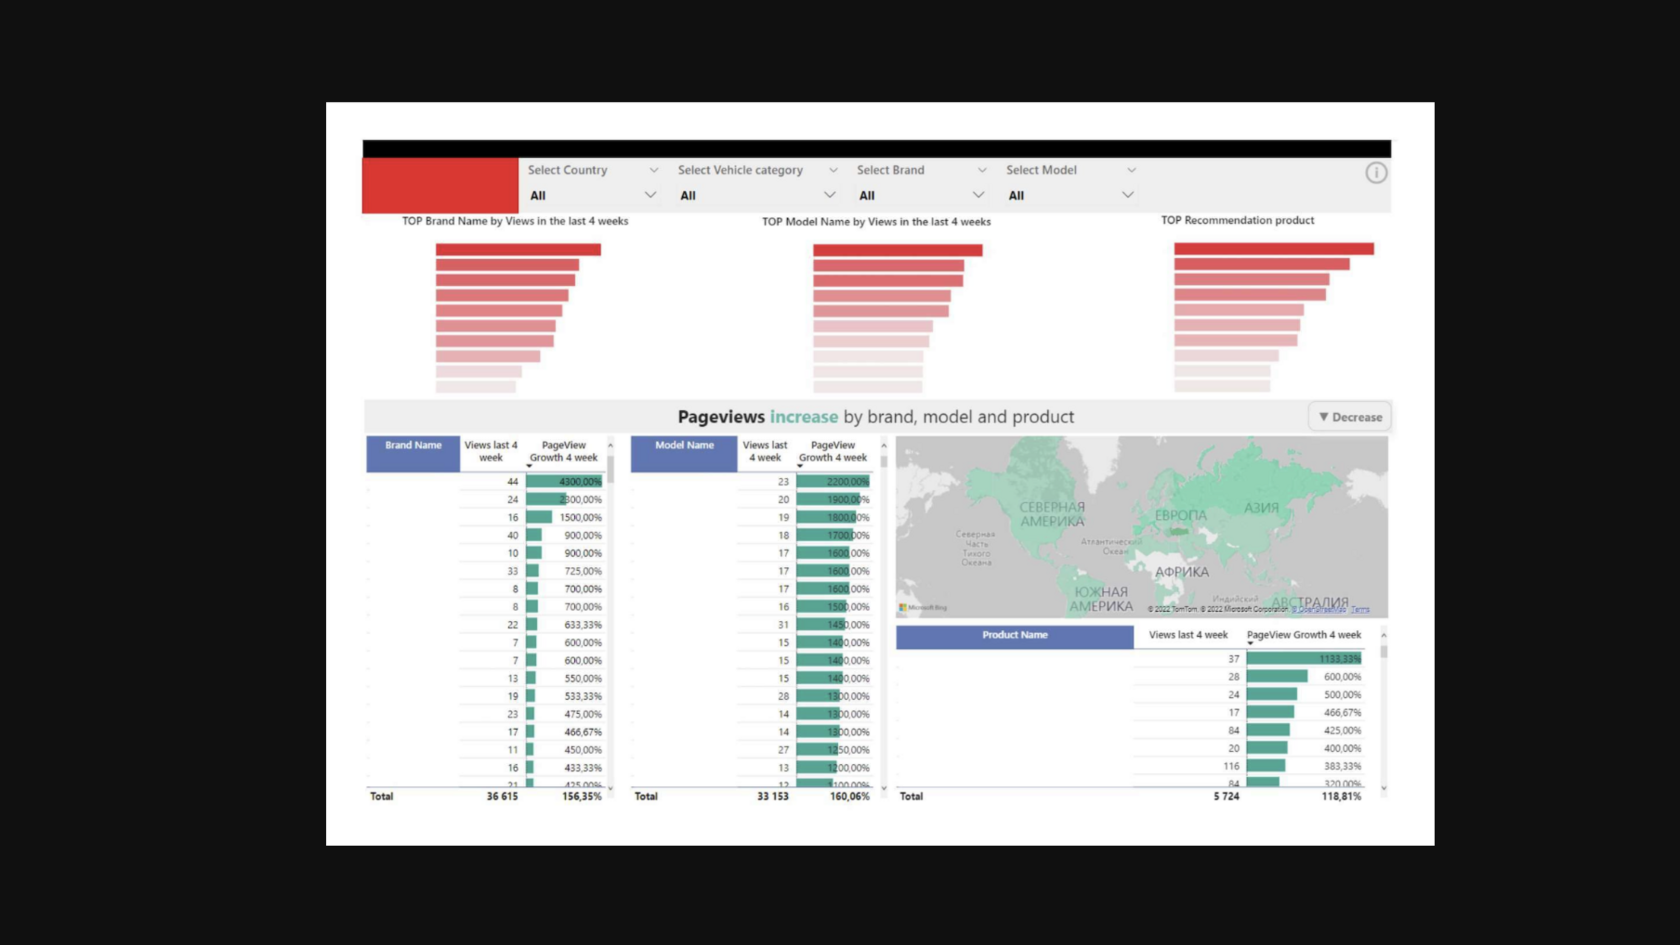
Data Visualization in Power BI
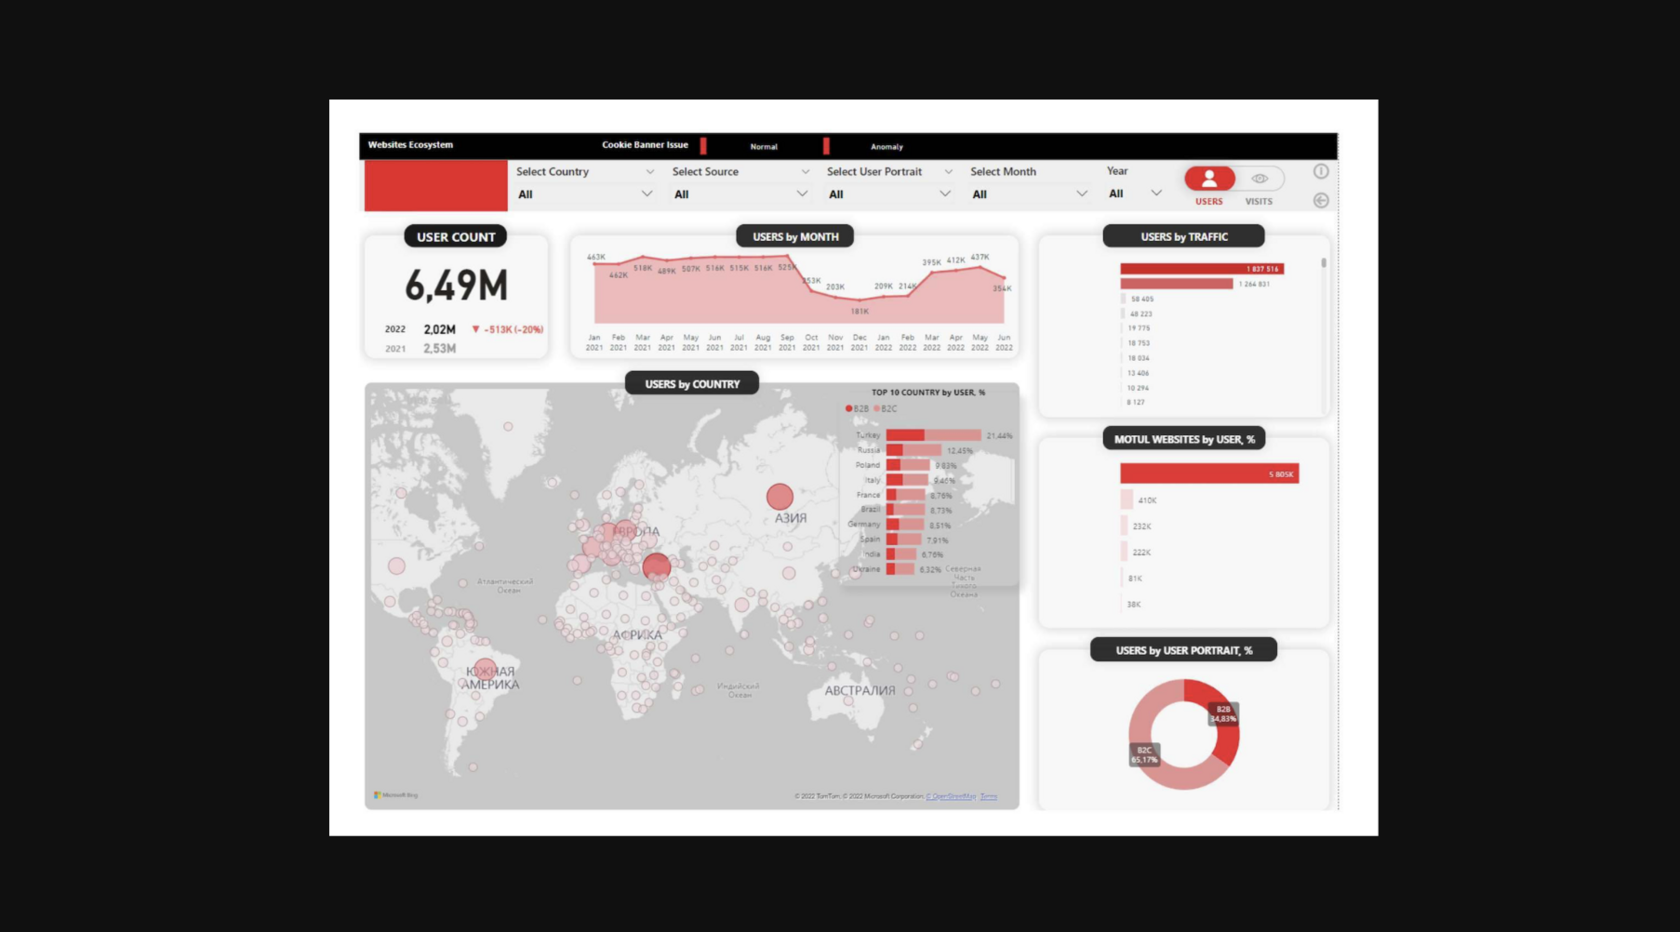

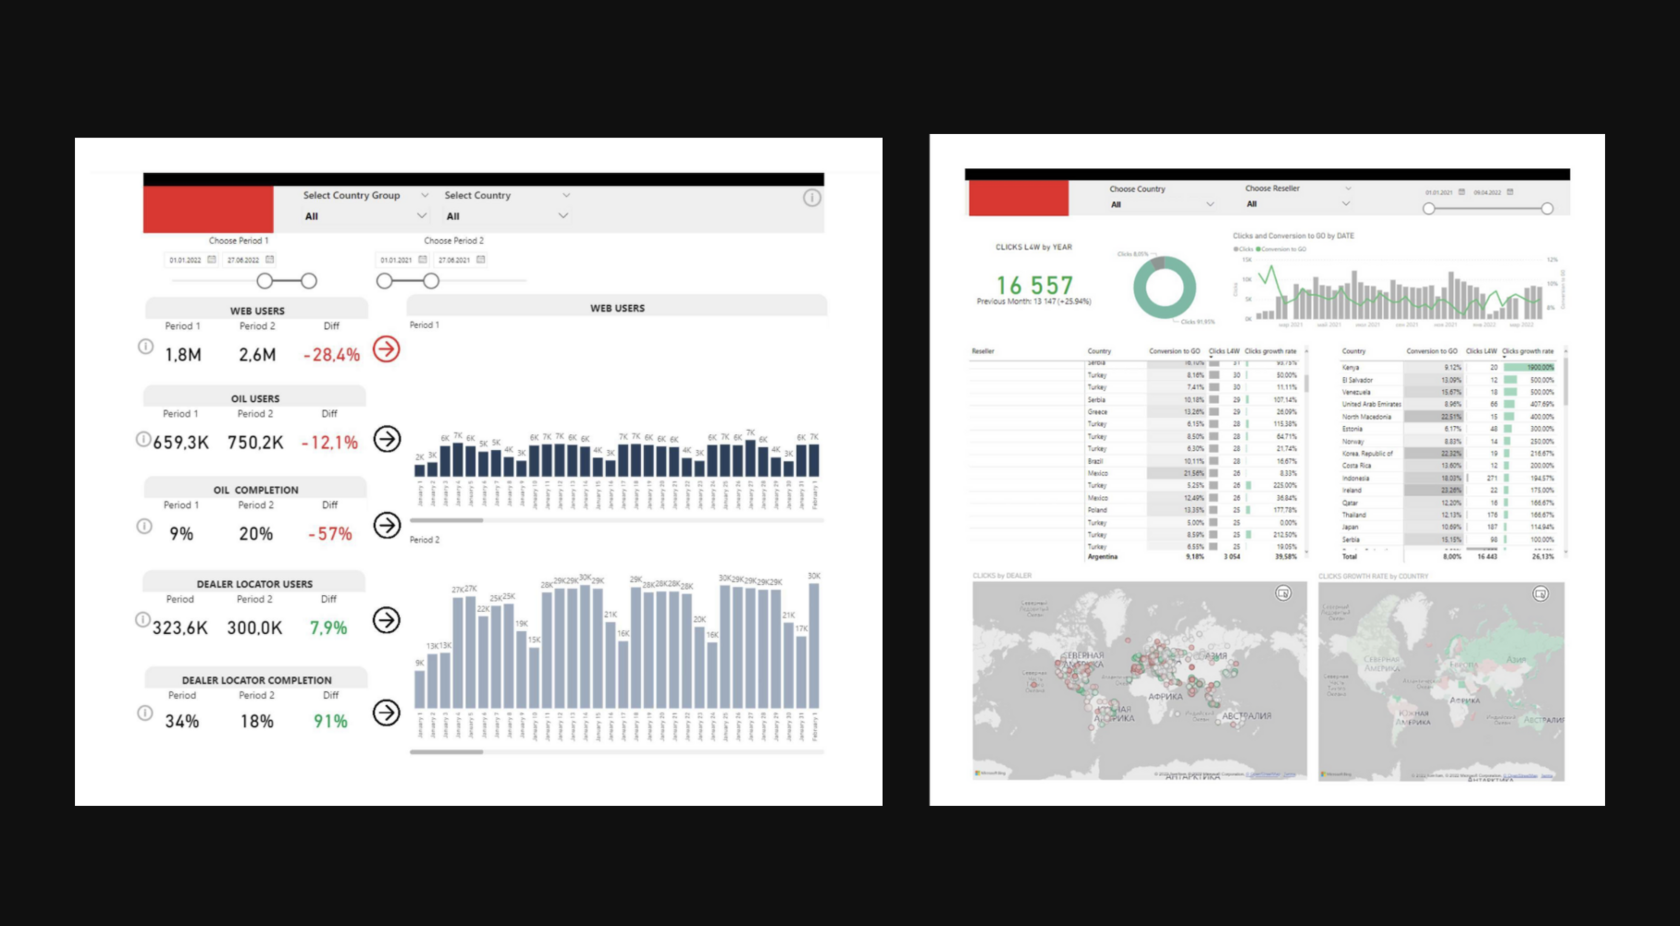
RESULTS
As part of the project, we:
- Gathered data from all of the client's sources and enriched it with the information needed for reporting.
- Automated reporting on key KPIs.

